Background
This Method Note outlines the Evidence for Action (E4A) funded study Impact of Greening on Cardiovascular Disease (CVD) in Low-Income Miami Neighborhoods as an example of how to apply the causal roadmap. We provide details about each causal roadmap (CRM) step. We refer to the Open Science Framework (osf) proposal for this study. The results of the study are coming soon!
by Dakota W. Cintron, PhD, EdM, MS; Ellicott C. Matthay, PhD; and Maria, Glymour, ScD, MS
Published July 30, 2021
Step One: Specify knowledge about the system to be studied using a causal model: What do we already know?
Background
Causal inference methods leverage what is already known (or assumed) to learn new information. Thus, understanding the system as well as possible, and specifying what assumptions would make sense in this setting, is key to good causal inference. The most important information here specifies other factors that influence the health outcome under study and whether those factors also influence the likelihood that an individual was exposed or treated. A causal model describes the causal relationships among variables under study. This knowledge can be represented with graphs (e.g., Directed Acyclic Graphs) and/or through structural equation models (which include constraints on the joint distributions of the error terms for different variables). Graphs are non-parametric so do not give information about the magnitude of effects but are extremely helpful as a starting point.
Greening Evaluation
Motivated by prior research finding that higher neighborhood greenness was associated with lower rates of cardiovascular disease (CVD) diagnoses in Medicare beneficiaries, this study set out to explore whether greenness and greening interventions (i.e., tree planting) impacts CVD incidence using a population- based, prospective and longitudinal quasi-experimental design in a sample of low-income Miami-Dade Medicare beneficiaries. The basic structural causal model for the hypothesis of interest for this study is represented by greenness/greening -> CVD. However, the study also considered potential confounders of neighborhood income, crime, racial/ethnic composition, and density of elderly population that might also influence both greening rates and CVD. A structural causal model can also help to understand potential confounders of greenness/greening (e.g., greenness/greening <- {confounder} -> CVD). A critical component of the assumed causal model is that neighborhoods receiving greening were selected effectively randomly from among those that were eligible for the program; eligibility was determined by the average income of neighborhood residents; and receiving greening was otherwise unrelated to characteristics of neighborhood residents.
Step Two: Specify the observed data and how it arose: What data will be used or collected for this study? What variables will be available in this data? For whom are these variables measured?
Background
After determining what background knowledge is established and developing a causal model, we need to define the link between observed data and the causal model. This requires being able to clearly describe the data collection process. How were study participants chosen and enrolled? Are the data complete? If certain features of potential study participants influenced whether they actually participated and provided data for analysis, those features must be considered (e.g., those determinants of participation may create selection bias, differential missingness, or bias due to attrition).
Greening Evaluation
The greening evaluation used observed data on both greening/greenness and CVD in Miami-Dade County census blocks. The study utilized Medicare claims data on beneficiaries living in low-income census blocks (i.e., the lowest income quartile; less than $31,700 median household income) to count CVD cases per census block. As such, the inferences should be restricted to older adults living in low income neighborhoods in Miami-Dade County, although researchers interested in other communities can evaluate whether effects are likely to be similar. Many research studies use specialized data sets collected as part of a research study, which entails that participants volunteer for the study. In these studies, the selection into the study is based on unknown factors that influence the individual’s decision to participate, and must be considered in this step. Use of an administrative data source with passive data accumulation is an advantage in this regard for the Miami-Dade Greening study.
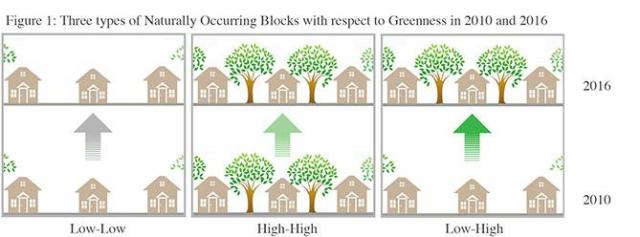
In the Miami-Dade Greening initiative, the census-blocks were classified into three groups by the level of natural greening in 2010 and 2016 using satellite imagery of the block. Blocks with no change in greening between 2010 and 2016 (either low greenery in both 2010 and 2016 or high greenery in both 2010 and 2016) were used as controls. Blocks that received a greening “intervention” were blocks that were in the lowest greening tertile in 2010 and highest greening tertile in 2016 (low-high classification). Urbanicity and sociodemographic data were obtained from the US Census. Neighborhood crime rates were obtained from the Miami-Dade County GIS services website. Greenness was measured using the Normalized Difference Vegetation Index available from NASA satellite imagery across the US at the block level.
Step Three: Specify what you want to learn, i.e., what causal effect are you trying to estimate?
Background
This might be the effect of a policy on the health of everyone in a specific population, the effect on the health of a specific subgroup in the population, or the effect on health equity. Causal effects can be formally expressed using potential outcomes (counterfactual) language. Sometimes questions that seem clear are actually ambiguous, and writing down a contrast of potential outcomes helps precisely define the causal question of interest. A potential outcome expresses what would happen to each individual’s health outcome under any specific treatment, regardless of which treatment the person actually received. Specifying the causal effect you are trying to estimate ("the target causal quantity" or "target causal estimand") ensures that the “scientific question drives the design of a data analysis and not vice versa” [p. 4, 1]. A common example of a target causal quantity is the average treatment effect (ATE)—that is, the difference in the average health outcome of the population if everyone were exposed to the intervention versus if no one were exposed to the intervention. Another target causal quantity might be the conditional average treatment effect (CATE). The CATE is generally an average treatment effect that is specific to a particular subgroup of individuals (e.g., the ATE among men or among women). Access our blog post on heterogeneous treatment effects.
Greening Evaluation
The study sought to estimate the effect of neighborhood greening interventions on CVD. The study registration did not specify whether they aimed to estimate the marginal effect in all eligible neighborhoods (i.e., the ATE, comparing greening all neighborhoods versus greening no neighborhoods) or the effect of the intervention on those whose neighborhoods were treated (i.e., the average treatment effect among the treated or ATT). Either estimand would be of interest and they would differ only if residents of the neighborhoods selected for intervention were more or less responsive to the intervention than residents of other neighborhoods. This is unlikely since we believe the neighborhoods were effectively randomly selected for intervention among all eligible neighborhoods. The causal parameter of interest is restricted to low-income neighborhoods, which would have been eligible for the intervention. Any effort to draw causal inferences about the effects of a greening intervention on residents of other neighborhoods requires additional assumptions. The researchers indicated they were interested in the relative risk of CVD onset due to the intervention.
Step 4: Assess whether, given what you already know, and the data you have available, is it possible to draw causal connections between the intervention and the causal effect you specified in step 3?
Background
Can all the relevant confounders specified in step 1 be measured and controlled? Is there a valid instrumental variable that can be used to identify causal effects? If not, in Step 5 you may need to make additional assumptions to achieve identifiability (e.g., assume a potential confounder is not important, or a proxy measure of that confounder fully captures its effects). Directed acyclic graphs are popular in part because they can be conveniently used to assess whether an effect can be estimated (i.e., is "identifiable"). A structural causal model can help codify potential identifiability issues based on background knowledge and link to the observed data (e.g., selection into treatment or attrition; see our graphical catalog of threats to validity).
Greening Evaluation
The investigators of the greening study used a quasi-experimental design to help ensure that they can answer the causal question specified in step 3. To validly estimate the effect of the greening intervention, the critical assumption (called “exchangeability”) is that, before the greening intervention, the CVD risk of people who live in neighborhoods that receive greening interventions did not differ on average from the CVD risk of people who live in neighborhoods that did not received the intervention, after accounting for the measured covariates (e.g., neighborhood income, crime, race/ethnicity, and age).

That is, to learn the answer to the causal question specified in step 3, we must assume that the measured potential confounders that were controlled in the analysis (e.g., neighborhood income, crime, racial/ethnic composition, and the number of elders per block) constitute all of the confounders of the greening intervention - CVD relationship and that the individuals captured in the study data are representative of all individuals in the target population (i.e., the population about whom we would like to make inferences).

Step 5: Revisit your assumptions (step 1), available data (step 2), and causal question (step 3) until you have settled on a causal question that can be answered given what you already know and the data you have available. Commit to a specific causal effect measure and statistical model representing the knowledge available to you.
Background
After moving through steps 1-4, we might conclude that our background knowledge and observed data do not allow us to estimate the target causal quantity of interest. Nonetheless, we may still need the “ ‘current best’ answer.”[1]. To achieve this answer we may need to make additional assumptions to claim identifiability or potentially narrow our causal question. Therefore, at this juncture, we select the additional assumptions we need to estimate the quantity of interest and we incorporate these into our causal model. We then need to translate our target causal quantity into a statistical model with a parameter that represents the answer to our causal question. The causal quantities desired in step 3 (e.g., a contrast of average potential outcomes if we gave everyone the intervention versus if we gave no one the intervention) are not directly observable, so we must choose a statistical quantity (e.g., a contrast of means in an exposed versus unexposed group) to represent the causal quantity. Choosing the statistical model will require more information on the distributions of the observed data (e.g., binary, normally distributed, time-to-event). For a binary outcome, we might choose a risk difference or a risk ratio as the estimand. Some aspects of the causal structure may require particular statistical approaches for valid causal identification. For example, time-varying confounder-mediators require special methods to control for the confounders without controlling for a mediator (see our blog post on time-varying confounding).
Greening Evaluation
The authors committed to the causal effects they were interested in and committed to using a “natural experiment” to implement a quasi-experimental study (i.e., risk ratios among naturally occurring groups exposed to greening). For example, they estimate the contrasts between potential CVD outcomes if everyone were treated versus nobody were treated (the causal quantity) by using the observed CVD outcomes in the treated neighborhoods versus the untreated neighborhoods. The CVD outcomes in the untreated neighborhoods serve as a proxy for the CVD outcomes in the treated neighborhoods had they not been treated, and vice versa. This analysis, therefore, relies on the assumptions that variables to account for all confounding pathways between the greening intervention - CVD relationship have been adequately measured and controlled, and that the individuals captured in the study data are representative of all individuals in the target population. The investigators committed to a causal model and statistical model that was representative of the knowledge they had at hand (i.e., the causal model included all relevant confounders and a statistical model with a dependent count variable of CVD and potential clustering in census blocks). Specifically, the statistical model was a multilevel model with a Poisson response distribution for the dependent variable to estimate the relative risk of CVD in exposed and unexposed groups that were naturally occurring in Miami-Dade County.

Step Six: Estimate.
Background
Given the statistical model and causal effect of interest, what estimation approach should be used to derive the causal quantity of interest? At this step, the investigator selects and applies an estimation approach (i.e., a statistical analysis) to estimate the causal quantity designated in step 5. The choice of an estimator does not impact the causal question being asked. However, different estimators (e.g., inverse probability weighting and propensity score matching) have different statistical properties. The choice about what estimator to use should be motivated by whether the differences between estimators result in meaningful differences in performance (e.g., precision or bias in causal estimate).
Greening Evaluation
The study will use a multilevel Poisson regression to estimate the relative risk of CVD in exposed versus unexposed groups while controlling for measured confounders.
Step Seven: Interpret.
Background
What causal interpretations of the results can be made? We must be explicit about our assumptions so readers can critically evaluate those assumptions. If the assumptions do not hold, then our statistical estimate likely diverges from the actual causal effect of interest. Any effort to make causal inferences should maintain an interpretation that is in accordance with the assumptions codified throughout the first six steps in the roadmap and explain what additional assumptions would be needed to extend the inference (e.g., to a new population).
Greening Evaluation
Results TBD!
References
- Petersen, M. L., & van der Laan, M. J. (2014). Causal models and learning from data: integrating causal modeling and statistical estimation. Epidemiology (Cambridge, Mass.), 25(3), 418.
The E4A Methods Lab was developed to address common methods questions or challenges in Culture of Health research. Our goals are to strengthen the research of E4A grantees and the larger community of population health researchers, to help prospective grantees recognize compelling research opportunities, and to stimulate cross-disciplinary conversation and appreciation across the community of population health researchers.
We welcome suggestions for new topics for briefs or training areas. Share suggestions with us by emailing evidenceforaction@ucsf.edu.